Azure Data Factory Data Flow
Creating a data flow to join CSV files for an ETL pipeline in Azure Data Factory.
As seen in my post Building a data pipeline with Azure Data Factory, one of the main components of the ETL pipeline is to transform and join the data sources into a master dataset.
Setup
The goal is to transform and join CSV files from a Storage Blob into a SQL Database.
See Creating Azure Resources to create many of the following:
- Create a resource group
- Create a security group
- Create a Storage Blob account
- Create an input container
- Load CSV files to container
- Create an output container
- Create an input container
- Create an Azure SQL Server
- Design the schema for the joined CSV file
- Create a database
- Create a table with the schema
- Create a Data Factory
- Create a Linked Service to Blob storage
- Create a Dataset to point to the Blob storage
- Create a Linked Service to Azure SQL Database
- Create a Dataset to point to the SQL Database
- Create a Pipeline
- Create a Data Flow (details below)
- Add the Data Flow to the Pipeline canvas
- Save All (if using GitHub repo) and Publish
Save All and Publish
- Creating the Data Factory, you should have created a GitHub repo
- Use
Save Allto commit to the repo - When you reached any step at any time where you know everything runs without issues, click
Publish
Create a Data Flow
- In the Data Factory
- On the left menu, Author/Edit interface
- Under
Factory ResourcesthenData Flow - Create a
New data flow - Name it
JoinInputCSVs - On the graph canvas section, an icon shows
Add source Save allto commit to the repository
Data Flow Workflow
- Create a source for every CSV file
- Add a transformation for each source
- Joined the transformed output to the dataset created above
OutputDataflowCSV
Optimization
Instead of creating a source for every CSV file. An optimization strategy could be to group CSV files with a common format in a Blob container (this isn’t covered in this blog post)
- In DataFlow create a parameterized component that gets a list of CSV names from this container
- Then create another component that loops through each of these files.
Using ‘Data flow debug’
This will allow you to preview the data as you transform it. However, it creates a Spark cluster for the period you specify (when enabling Debug).
Enable Data flow debug
- Click on
Data flow debug - Stop debug mode when you are done transforming the data.
- You can change the number of rows to preview.
- I set my rows to
100. The default is1000- This setting is changed to the default every time you stop/start a Debug instance.
Spark cluster
- Enabling
Data flow debugstarts a Spark cluster - They will charge you for the time the cluster is running.
- See my post on Azure Data Factory Pricing
Creating triggers
- The Spark cluster doesn’t start instantly.
- I’ve seen it take 1-5 minutes to create and start.
- Take into account this delay when creating scheduling triggers.
Data preview
- When selecting a card step in the data flow
- Go to the tab
Data Previewand clickRefresh - After sending the data to the cluster for processing.
- It will show the result of the selected card with
100 rows(if this was changed from the 1000 rows default)
Build the Data Flow
Create a Source
- On the graph canvas section, click on
Add source Settingstab- Enter a name, for example
TexasCSV - In Source type, select
Inline - In Dataset type, select
DelimitedText - Select the Linked service,
InputBlob - Sampling set to
Disable
- Enter a name, for example
Optionstab- Select the
File pathusingBrowse - For this source
TexasCSV. My file path wasdbeapp/inputCSV/texas-dbe.csv - Select
First row as header
- Select the
Save allto commit to the repository
About Sampling set in Disable mode:
Don’t confuse this with debugging, which displays a number of rows to preview. If Enabled, this will filter the dataset to the specified number of rows. In other words, if your CSV file has 1M rows and you sample it to 10 rows. The output will contain 10 rows. As the legend says. Enable this for debugging and testing. But it doesn’t clarify to disable once you are done debugging.
Debug what you have so far
- Enable
Data flow debug(if you didn’t enable it before) - Change
Debug settingswith a row limit of100 - In
Source Settingstab- In
Linked Serviceclick onTest connection
- In
- In
Data previewtab- Click
Refresh - If you get the error
The gateway did not receive a response from 'Microsoft.DataFactory'- Disable Debug and Enable again
- Click
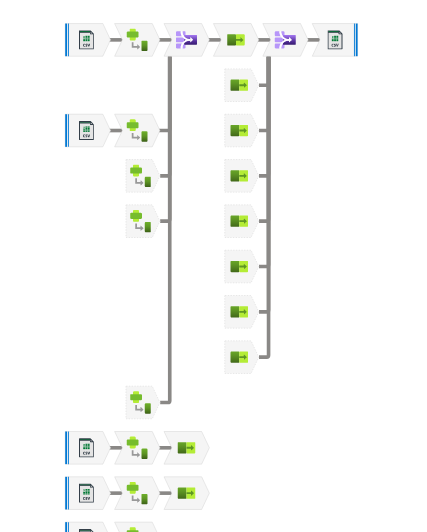
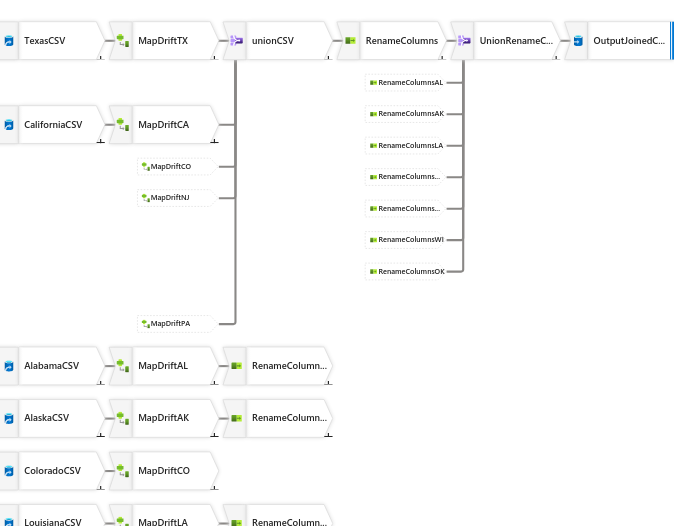
Final result of the Data Flow, a closer look:
Schema Evolution and Schema Drift
If the schema at the source is most likely to change. Then in the dataset Schema settings, don’t import the schema. When setting up a workflow in a Data Flow, select the setting Allow schema drift and set the mapping to Auto mapping.
Data Transformation: RenameColumns
I want these columns:
CompanyName, DBAName, Address, City, State, Zip, Website, Agency, CertificationType, Capability, County
On the Source card (In my example TexasCSV)
- Go the
Data previewtab - Click
Map drifted - This creates a new connecting card called
MapDrifted
On the MapDrifted card
- Change the name to your naming convention. In my example I changed to
MapDriftTX - Remove the columns to exclude
- Click on the plus
+icon to create another component and click onSelect
On the Select card
- Change name to
RenameColumns - Next to
Input columns, uncheckAuto mapping(it should be unchecked already) - Then map the columns from the left
MapDriftTXto theName as(columns to keep) - Rename the columns
- In
Data previewtab, clickRefresh Save allto commit to the repository
Add Output to a Sink
On the RenameColumns (Select card):
- Click on the plus
+icon - Select
DestinationthenSink Sinktab- Change name to
OutputJoinedCSV - Sink type
Dataset - Dataset, select
OutputDataflowCSVandTest Connection
- Change name to
Settingstab- File name option, select
Output to single file- Since Spark uses HDFS, it will break the output into many files, when selecting
Default - Changing to
single filewill show this warningOutput to single file requires Single Partition to be the selected partition type. This setting may impact performance and should only be used for smaller datasetsand a button toSet single partition - In
Output to single fileenter a name likedbe-joined.csv - Select the box
Clear the folder(keep in mind this will delete contents of the output container)
- Since Spark uses HDFS, it will break the output into many files, when selecting
- File name option, select
Save allto commit to the repository
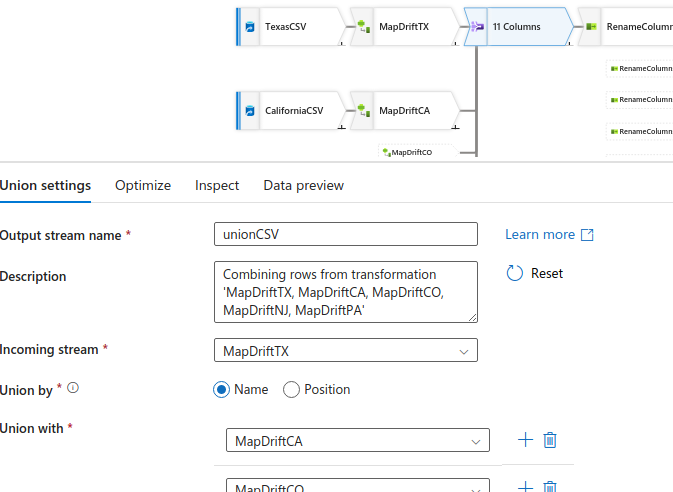
Using Union or Join
Use Union:
- If different sources have the same columns and you want to row-wise append one to another
- The same as SQL Union
Use Join:
- If you want to join two sources by a common column
- The same as SQL Join
Use the tab Inspect
- Use this preview to verify that the columns across all
UnionorJoinmatch
Columns in different sources don’t match
What I realized from my CSV files was that some had more/fewer columns. I couldn’t do a Union at the source.
- For each source, add the source and map drift the schema
- In Map Drifted, remove the columns to exclude
- On that card, add a
Unionto integrate the data sources toRenameColumns
Run the Dataflow in the Pipeline
- Open the
Pipeline - Under
ActivitiesthenMove & transform - Drag/Drop
Data flowto the canvas - Name
JoinInputCSVs - Settings tab
- Select the dataflow
- Run on (Azure or IR). Leave default
- Compute size. Leave default
Small
- Click on the canvas
- On the
Debugdrop down, selectIntegration Runtime- At the bottom
Outputtab, it should show aPipeline run ID
- At the bottom
- Click on
Data flow debug- It shows a process running with status
In Progress - For my run, it took 53 seconds
- It shows a process running with status
Save allto commit to the repository
It takes too long to run
- Click on the Pipeline canvas
- Review the
Outputtab to see thedurationtime - If it’s too long. Click on the
glassesicon - This will show the processing time for each step
- Click on each step to review
Rows calculatedandTotal partition
Using the Optimize tab in Dataflow steps
- On the Data Flow, click on a step
- There is a tab called
Optimize - There are three options:
Single partition- Select this if the datasets are small, otherwise the pipeline will take longer to run
Use current partitioning- Select this if the datasets are large
Set partitioning- You can select the type of algorithm
Partition types: Round robin, Hash, Dynamic range, Fixed range, Key- Also select the
Number of partitions
Verify the content in the Blob container
- Go to the output container
- Verify that the file was created. In my case it was called
dbe-joined.csv - Can’t preview this file in
Edit(the limit is about 2MB) - Download the CSV to review with another tool
Publish and stop debug
Azure will charge you for the resources of running the Spark cluster.
- Once you are done working with Data Flow, whether the work is completed or not.
- Turn
debugoff - Save all and Publish.
Create a schedule trigger
Optionally, create a schedule trigger to run the Data Flow. See Azure Data Factory Scheduling