Power BI Create a Hierarchy with Lookupvalue
How to create a hierarchy in Power BI with Lookupvalue.
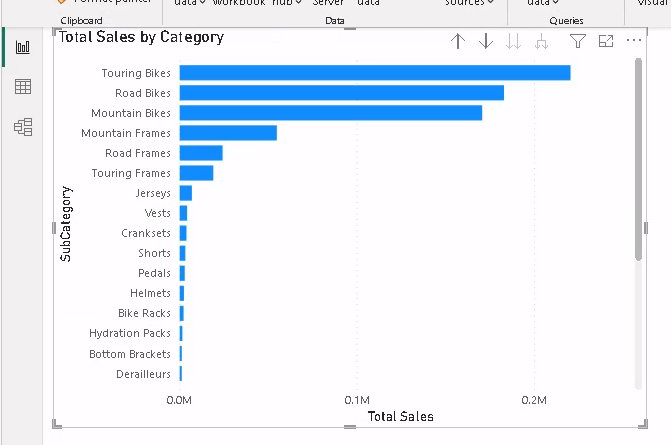
Requirements:
- DAX function
LOOKUPVALUE - DAX function
PATH - These functions might not work in
DirectQueryorDualstorage mode
Creating a column with DAX in Data vs M in PowerQuery
I am creating a hierarchy by creating columns using DAX in the Data interface. The changes can be seen in the Model. However, the changes aren’t reflected in PowerQuery. Why?
In a PBI forum I found this question. Why adding a column with DAX doesn’t update PowerQuery? The answer said that making modifications to the Model is unidirectional. Meaning that you can make changes in PowerQuery, which will reflect outwards into the Model. However, if you make changes in the Model, they won’t reflect inwards into PowerQuery.
A user also answered that they don’t recommend using DAX to modify the model, and that DAX should be used only for creating measures and aggregations. However, the Microsoft docs show using DAX to modify the model.
Change storage mode to Import
- On Power BI, model interface
- Click on the table
- On the right, go to
Properties, thenAdvanced - Change
Storage modetoImport(if it was in DirectQuery) - It might ask to change to
Dual, however the functions might not work in that mode
Setup an example with Azure SQL Databases
Follow this post on PowerBI with Azure SQL Database to create a sample database in Azure SQL Database with AdventureWorksLT.
In Power BI, connect to Azure SQL Database, and select the table SalesLT ProductCategory, choose Import storage.
Open the Data interface.
This table has these columns: ProductCategoryID, ParentProductCategoryID, Name
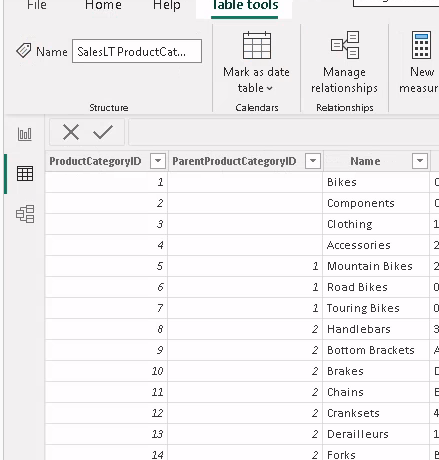
There isn’t a column ParentName. We need the string values of ParentProductCategoryID to create a hierarchy of Category/SubCategory.
DAX LOOKUPVALUE is similar to Excel VLOOKUP
The Microsoft docs are pretty confusing about DAX LOOKUPVALUE function. This is similar to the Vlookup function in Excel. Given a value, search in a cell range where the lookup value should always be the first column, and return the column number containing the result value.
DAX LOOKUPVALUE is like Excel VLOOKUP but backwards
=VLOOKUP(LookupValue, ColumnIndex, ColumnResult)

=LOOKUPVALUE(ColumnResult, ColumnIndex, LookupValue)
ColumnIndex is not necessarily an index.
Create a ParentName column
Go to PowerBI, Data interface.
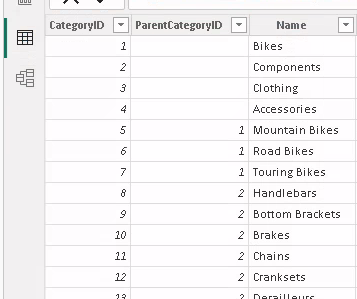
I changed the table name and columns so they are shorter.
- Table from
SalesLT ProductCategorytoProductCategory - Columns
ProductCategoryIDtoCategoryIDParentProductCategoryIDtoParentCategoryID
Looking again at my syntax:
=LOOKUPVALUE(ColumnResult, ColumnIndex, LookupValue)
Nameis likeColumnResultCategoryIDis likeColumnIndexParentCategoryIDis likeLookupValue
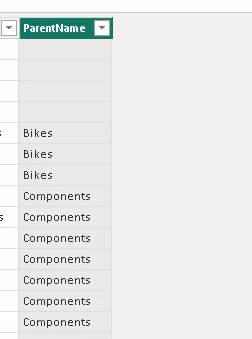
Create a column ParentName
ParentName = LOOKUPVALUE('ProductCategory'[Name], 'ProductCategory'[CategoryID], [ParentCategoryID])
Create a Path Column
Use the PATH DAX function to create a hierarchy path from child to parent values. It uses this syntax:
PATH(ChildColumn, ParentColumn)
In our case we are going to use the string values and not the IDs:
Path = PATH('ProductCategory'[Name], 'ProductCategory'[ParentName])
This creates a sequence of Parent/Child strings separated by a pipe | symbol.
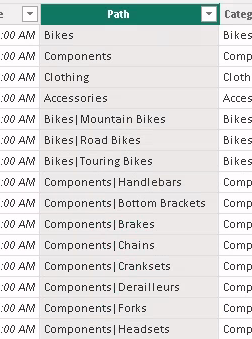
Unpivot the Path column to Path items
Use the PATHITEM DAX function to unpivot the column Path so that it splits the values by the pipe symbol into different columns.
Create the first column Category:
Category = PATHITEM('ProductCategory'[Path], 1)
Create the second column SubCategory:
SubCategory = PATHITEM('ProductCategory'[Path], 2)
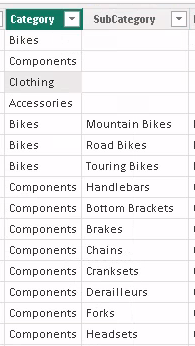
Create the hierarchy
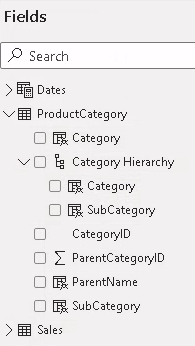
Go to the Report interface. In the Fields section.
- Under table
ProductCategory - Right click
Category - Select new hierarchy
- On the
SubCategorycolumn, click on the three dots, move it to the new hierarchy.
Create a stacked bar chart
- Move to Y axis the whole hierarchy
- Move to X axis a
Line Totalfrom aSalestable
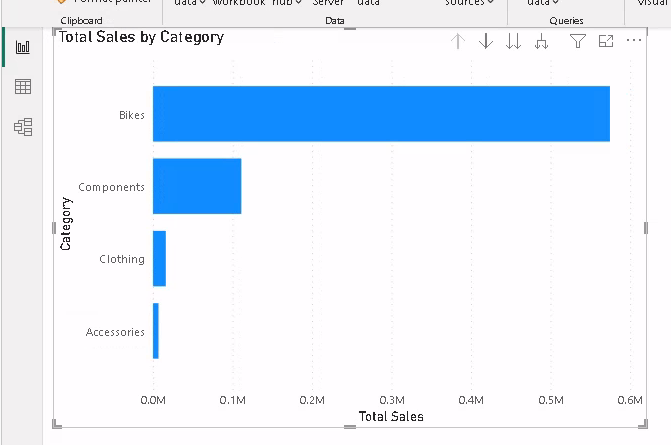
On the visual use the double arrow down to go to the next hierarchy level.
