Power BI with Azure and Data Analytics Trends
Using Power BI with Azure to find trends in data analytics from Google Ads and StackOverflow.
Motivation
I was looking at my Google Search Console account, and one of the reports showed that people have been searching for a problem I wrote about: Azure Virtual Machine Agent Status Not Ready
I wondered what other topics related to Azure and Power BI people were searching for.
Goal
Create a dashboard about Azure/Power BI topics that people care about. The dashboard should show insights about topics or keywords that people are searching for.
Who is this dashboard for?
Anyone looking to:
- Improve their SEO by writing content related to Azure or Power BI
- Find trends/patterns about Azure, Power BI, and related topics
Datasets Sources
Google Ads
Google Ads has a tool called Keyword Planner, to research keywords when buying Google Ads. I thought of using the API, as shown in this Google doc, and connecting to it from Azure. However, it has a note that said ...cache or store results as you will receive the same response over a long time span.
There is no need to complicate this too much. I used the UI to make a few queries, and saved the CSV results in Azure Blob storage.
StackOverflow
StackOverflow publishes its datasets for anyone to analyze in the Internet Archive here. The dataset I was interested in was about 19GB. It didn’t make sense to download it locally as it would take 4-5 hours. I thought of downloading the file directly into Azure Blob storage, but I only wanted a much smaller subset as a source.
For future reference, here is more info about the Azure Python SDK. Use it to copy files from the web to Azure Blob Storage.
- Azure Blob Storage client library in Python here
- Here is a similar doc but not sure if it is a newer or older version here
- Complete Azure SDK in Python docs here
I decided to use the StackOverflow query interface to create a subset of the dataset. Then upload the CSV files to Azure Blob Storage.
Also, from the Internet Archive, I downloaded the dataset that contained all the StackOverflow tags. This file was in XML. I cleaned the data and saved it as CSV. You can tell that StackOverflow is made with .NET because that’s the first tag in the table :)
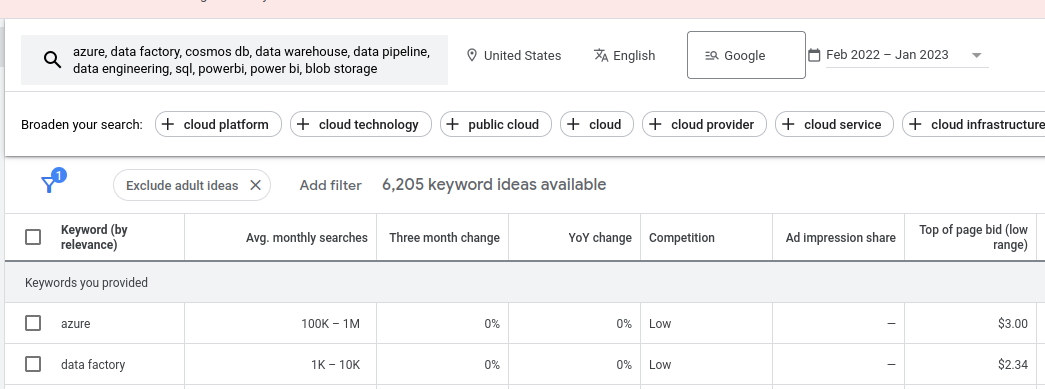
Dataset from Google Ads
In the Keyword Planner UI, you can enter up to 10 keywords per search and it outputs a dataset of keyword ideas, average monthly searches per keyword, competition level, and estimated price to bid on ads.
Datasets
- 3 datasets, joined to 1 CSV file
- Total rows ~12,000
Schema
These details are from Google Ads:
Monthly Searches: The average number of times people search for a keyword and similar terms based on the month range, the location, and your Search Network settings. This information shows how popular your keywords are during different times of the year. This range is averaged over a 12-month period.Competition: how competitive ad placement is for a keyword, specific to the location and Search Network targeting options that you’ve selected. The level of competition—low, medium, or high— is determined by the number of advertisers bidding on each keyword relative to all keywords across Google. If we don’t have enough data, you’ll see a dash (-).Bid Low/High Range: Range of what advertisers have historically paid for a keyword’s top-of-page bid, based on your location and Search Network settings. The average CPC of your keywords may vary.
Dataset from StackOverflow
I wrote a blog post called Query StackOverflow with SQL
StackOverflow has an interface called Data Explorer where you can create a SQL query to pull subsets of data from their giant datasets.
I wrote a SQL query, as seen in this link Find posts by tags and order by views, to find the top questions based on tags and views.
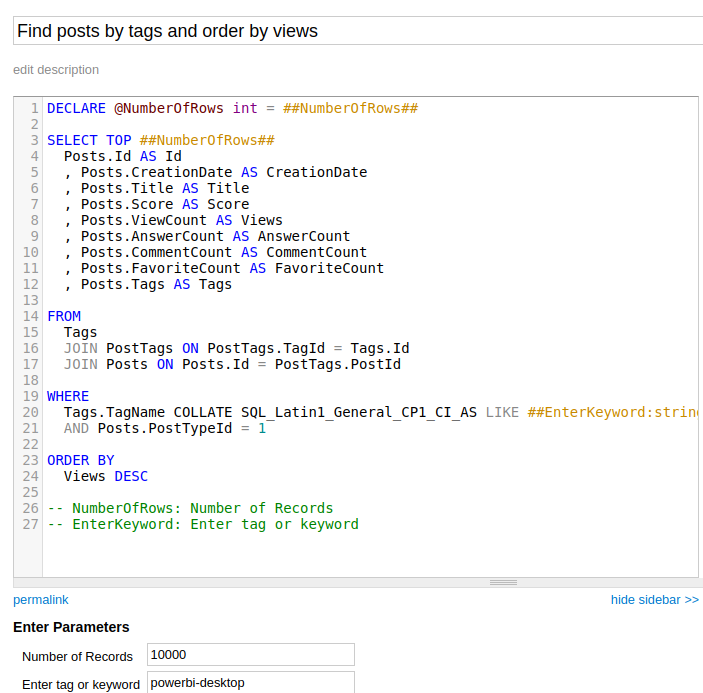
For example, I wanted to find the top N questions with the most views for the tag azure. I ran the query with other relevant keywords that generated a few CSV files.
I also wanted to know which were the top relevant tags. I wrote another SQL query called Find top tags by count
Datasets
- 14 datasets, joined to 1 CSV file
- Total rows ~100,000
Schema
Id, int
CreationDate, datetime
Score, int
ViewCount, int
Title, nvarchar (250)
Tags, nvarchar (250)
AnswerCount, int
CommentCount, int
Load Datasets to Azure Blob Storage
Uploaded three datasets to an Azure Blob Storage container
- stackoverflow-query-joined.csv
- googleads-dataset-tab.csv
- stackoverflow-tags.csv
Create a data model in Power BI
Power Query
- Loaded the files in PowerBI and transformed them with PowerQuery.
- Replaced null with zero in numeric columns. Left null in string columns.
- Removed duplicates. Renamed queries and columns. Removed columns.
- Added an index column to the GoogleAds dataset.
- Completed other transformations.
Power Query and StackOverflow Tag Column
The StackOverflow dataset had a Tag column with this format:
"<sql><sql-server><database><sql-server-2008><azure-sql-database>"
"<azure-web-roles><azure-vm-role>"
"<kubernetes><azure-aks>"
"<git><visual-studio><azure-devops><visual-studio-2017>"
I cleaned the rows and separated the values with commas, split them into five columns by comma, then unpivoted the columns to one column, to show one tag per row.
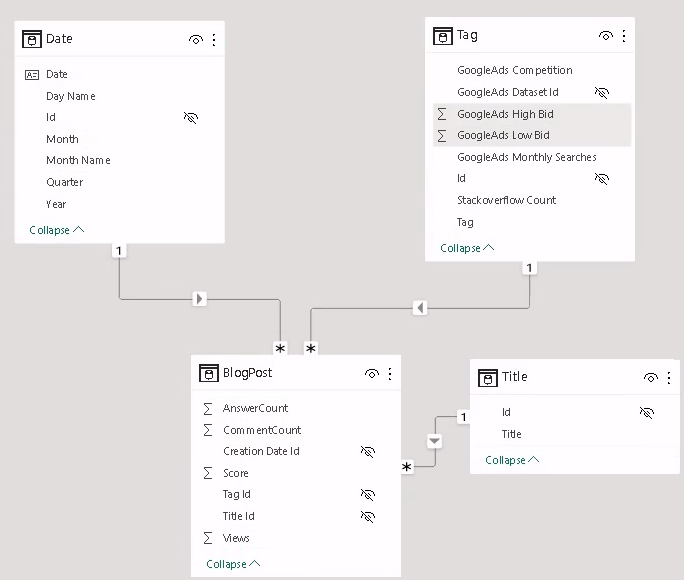
Power Query Star Schema Transformations
- Extracted the StackOverflow Post Titles to a dim table
- Left joined the StackOverflow Tag table with the GoogleAds dataset to keep all the SO tags
- Created a dim Date table using M
- Created the fact table BlogPost
Created measures
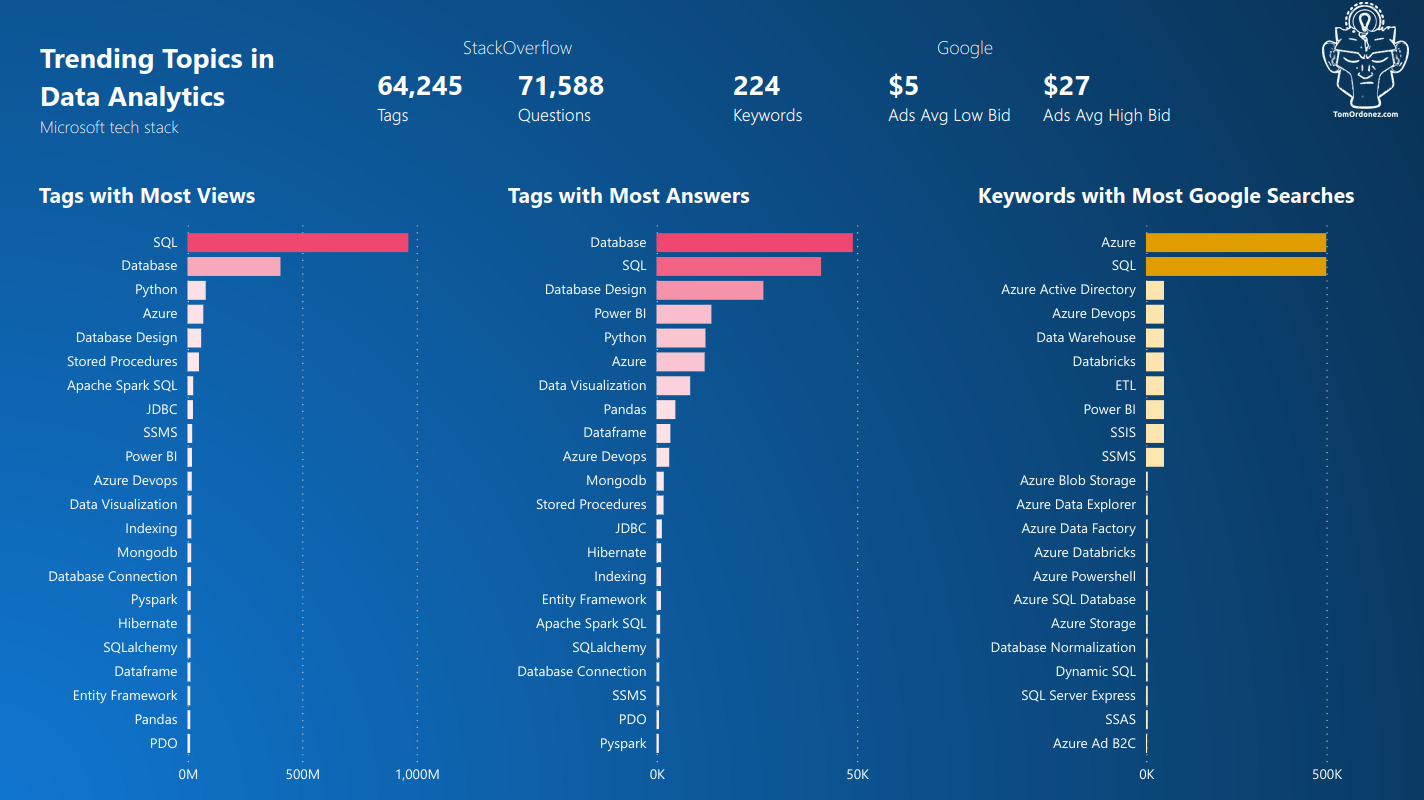
Tags with the Most Views
Tags Most Views = RANKX(ALL(Tag[Tag]), SUMX(RELATEDTABLE(BlogPost), [Views]),, DESC, Dense)
Then used it as a filter for the visual, setting the filter to is less than a number.
Titles with the Most Views
Titles Most Views = RANKX(ALL(Title[Title]), SUMX(RELATEDTABLE(BlogPost), [Views]),, DESC, Dense)
Created other measures to show:
- Number of tags and questions in StackOverflow
- Google Ads averages for low and high bids
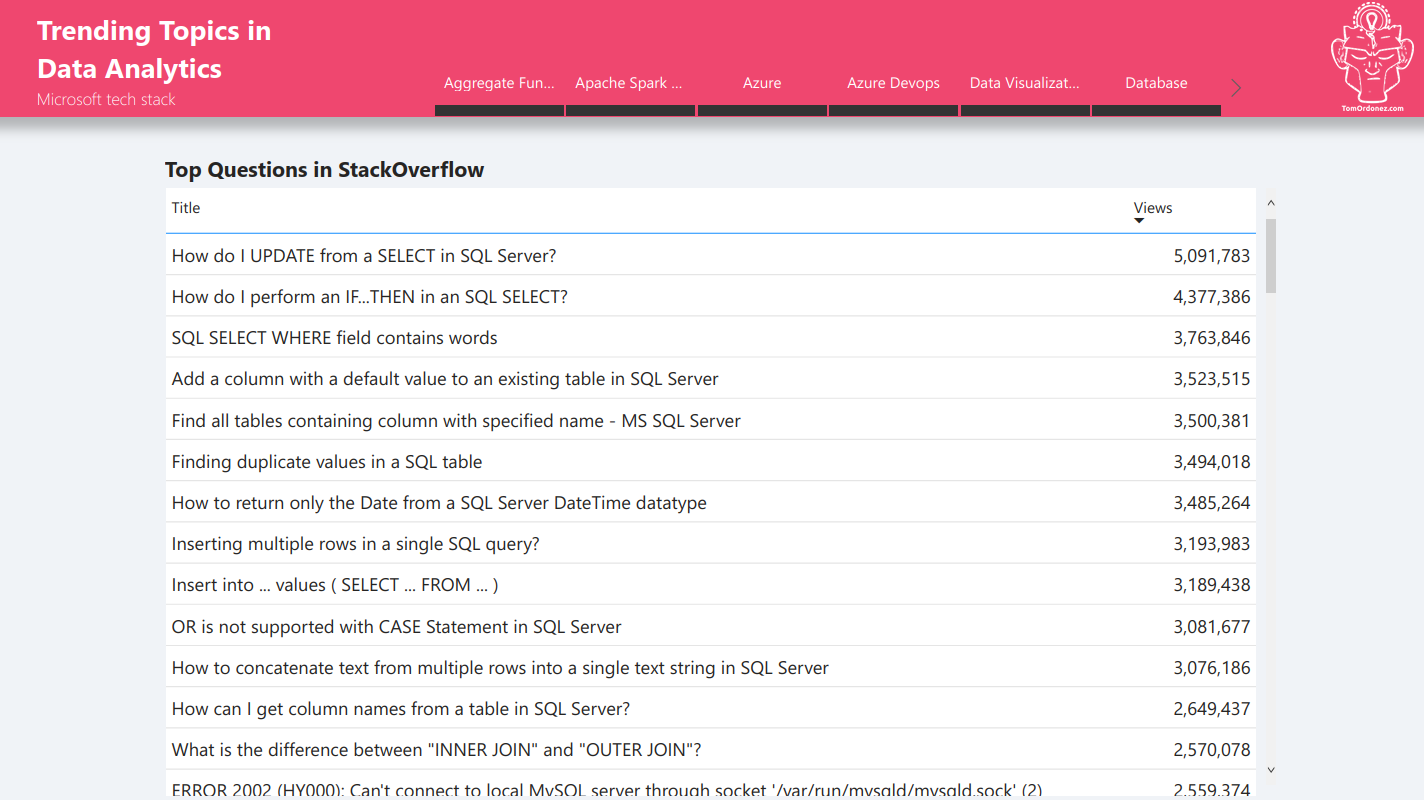
Trending Topics in Data Analytics
Top Questions in StackOverflow