D3 Using Scales
Understanding scales in D3. This is where things get interesting with D3, and you can spend countless hours trying to fix a visualization in the SVG way. More about D3 Drawing SVG
Definitions:
Input domainis the range of input data valuesOutput rangeis the range of output values
Given a dataset such as:
dataset = [5, 10, 15, 20]
Using scales in D3 require to map a range of input values to a range of output values.
- Input domain:
[5, 20] - Output range:
[10, 250]in pixels.
The minimum input value of 5 is represented as 10px, and the maximum value of 20 is represented as 250px.
The input value can be normalized and this result can be scaled to the output. For example, normalizing input values to a range of 0 to 1.
0 can be represented as 0px and 1 as 250px.
The rectangles on this bar chart look too short compared to the SVG canvas:
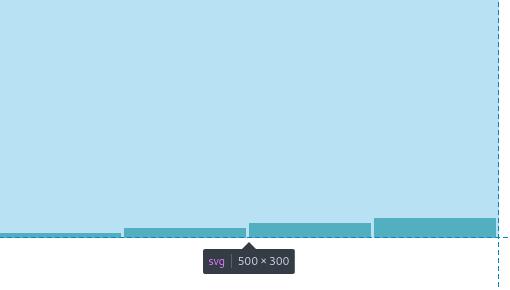
The rectangles can be scaled to improve the visualization.